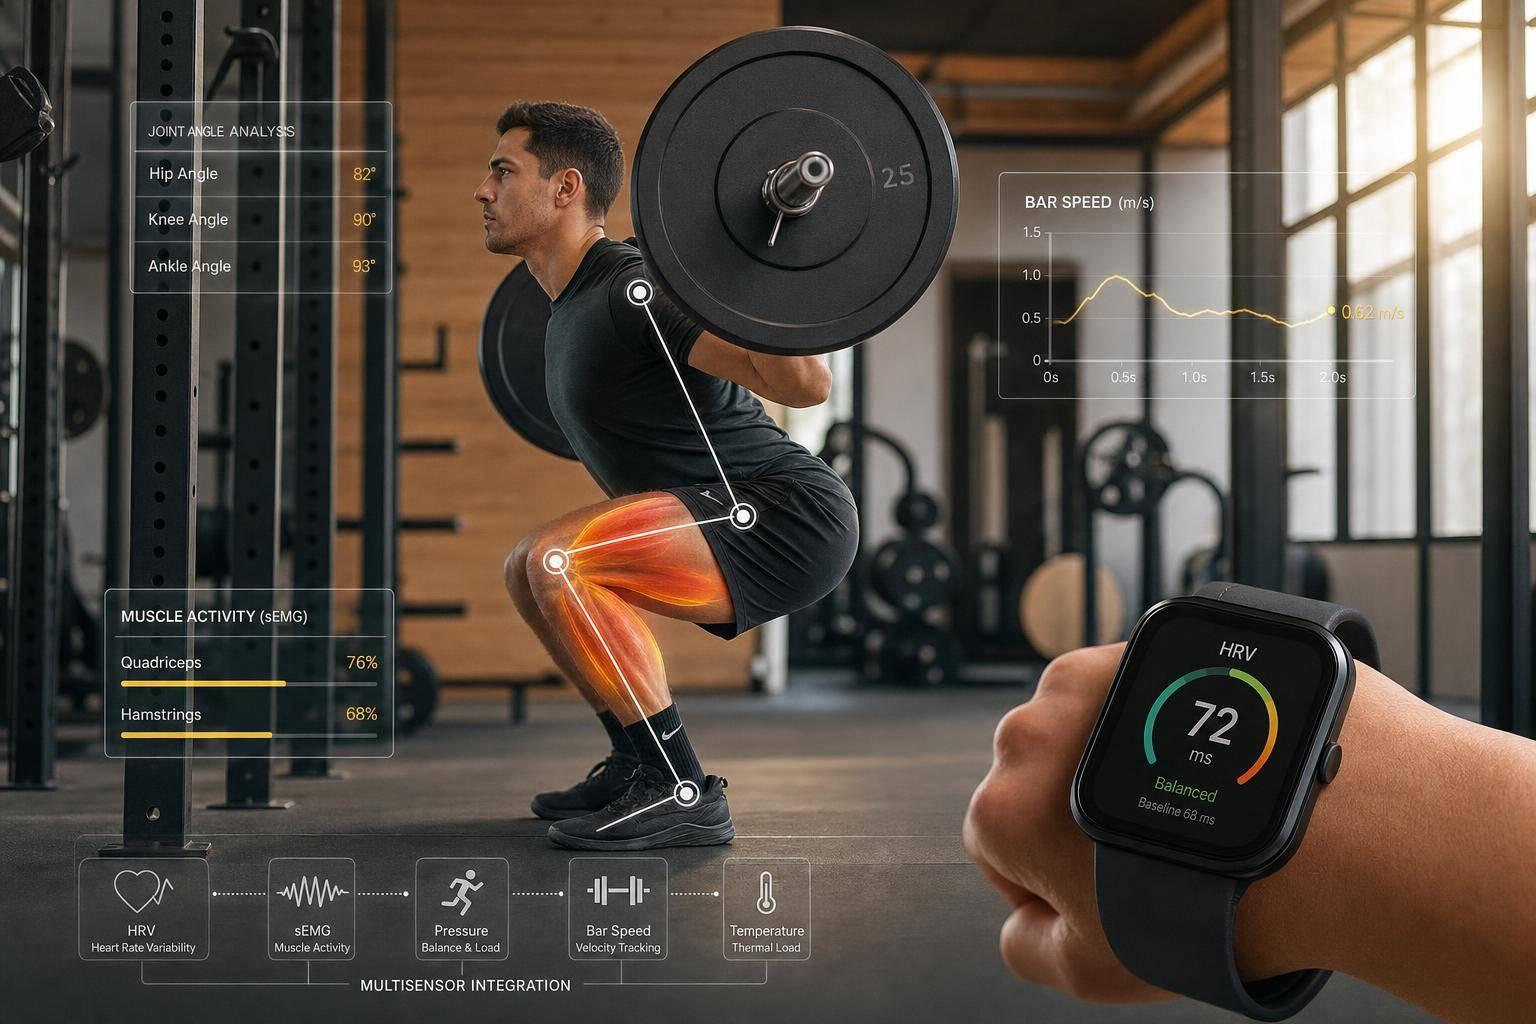
5 Ways AI Detects Fatigue in Strength Training
AI can spot fatigue before a bad rep makes it obvious. In strength training, that usually shows up in five places: your form, bar speed, muscle signal, heart-rate patterns, and a combined fatigue score from multiple inputs.
If I had to boil the article down to one point, it’s this: no single metric tells me the whole story. Video helps me see form drift. Bar velocity shows output loss. sEMG points to which muscle is fading. HRV gives me a whole-body recovery check. And multisensor systems try to pull those signals into one score.
Here’s the simple takeaway for training:
- Computer vision: best for spotting visible technique changes during squat, bench, and deadlift
- Bar velocity: best for seeing rep-to-rep slowdown, often with 10%–20% loss used for strength work
- sEMG: best for local muscle fatigue, like triceps or quads fading first
- HRV: best for day-to-day recovery trends, often tracked over 7 to 14 days
- Data fusion: best for a broader fatigue view, but it needs more tools and setup
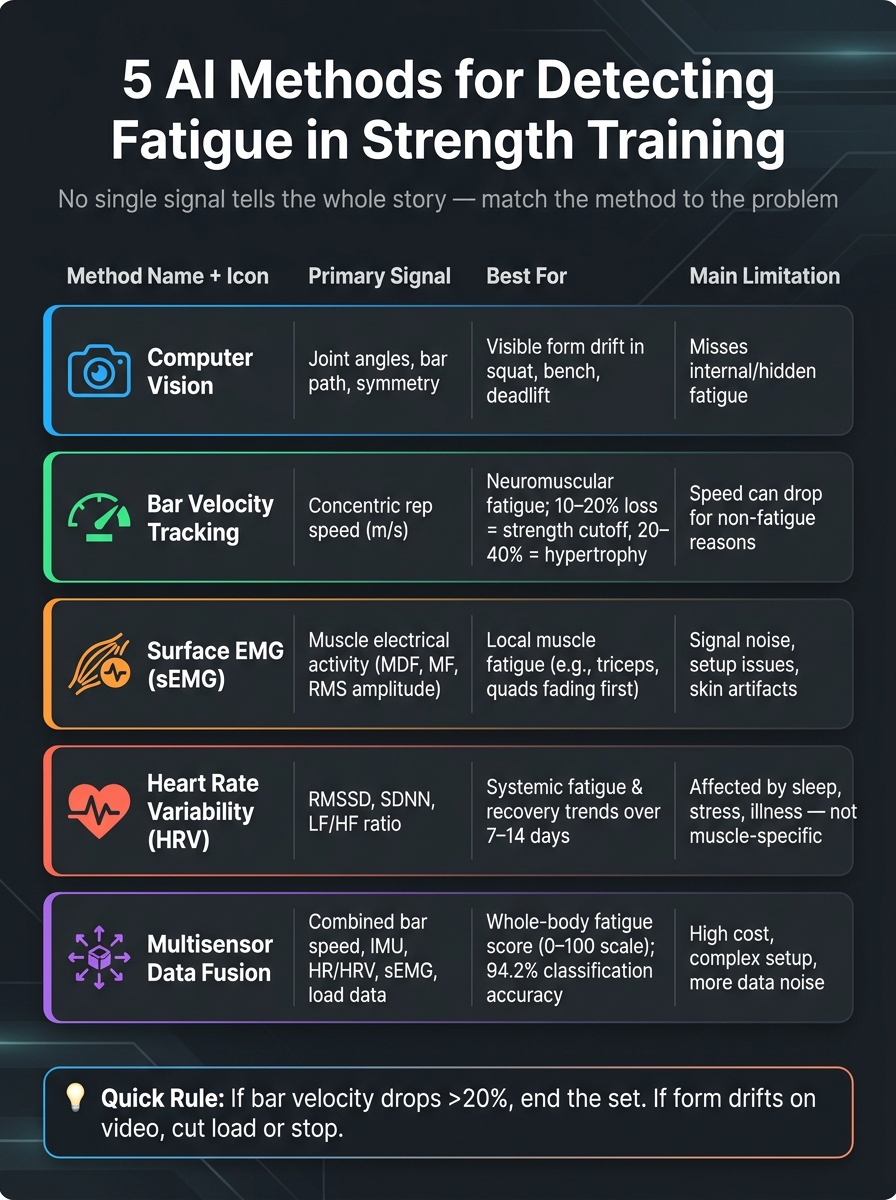
5 AI Fatigue Detection Methods for Strength Training: Side-by-Side Comparison
Quick Comparison
| Method | Main signal | Best for | Main downside |
|---|---|---|---|
| Computer vision | Joint angles, bar path, symmetry | Visible form breakdown | Misses hidden internal fatigue |
| Bar velocity | Concentric rep speed | Neuromuscular fatigue during sets | Speed can drop for reasons besides fatigue |
| sEMG | Muscle electrical activity | Local muscle fatigue | Signal noise and setup issues |
| HRV | RMSSD and other heart-rate markers | Systemic fatigue and recovery | Affected by sleep, stress, and illness |
| Multisensor fusion | Combined movement, speed, HRV, and load data | Whole-body fatigue score | More cost, more setup, more noise |
What I like here is the clear use case: pick one signal, tie it to one action. For example, if bar speed drops by more than 20%, I can end the set. If video shows squat depth and torso position slipping, I can cut load or stop before the next rep gets ugly.
That’s the core of the article in plain English: AI doesn’t replace judgment; it gives me better timing and better feedback when fatigue starts to build.
Why AI Beats Guesswork for Fatigue Management
Soreness, low motivation, and bad sleep all matter. But they don’t tell you if you’re ready right now.
They can hint at how you’re doing overall, yet they still can’t show rep-by-rep fatigue while you’re lifting. And that’s the moment that counts most. Fatigue doesn’t wait until after the set. It shows up during the set, when movement quality starts to slip.
That’s where AI has an edge. It tracks movement speed, form drift, muscle activity, and recovery signals so it can spot fatigue sooner. In plain terms, it picks up on changes before the lifter notices them.
That early warning matters. AI catches the drift before technique breaks down enough to push injury risk higher.
At the same time, no single signal tells the whole story. Each one leaves a gap:
| Signal | What it misses |
|---|---|
| Soreness / motivation | Hidden neuromuscular fatigue; day-to-day technique drift [3][4] |
| Bar velocity alone | Context for why performance is dropping |
| HRV alone | Differences in recovery demands across strength protocols |
| Subjective RPE | Consistency under heavy loads |
First up: computer vision, which spots form breakdown in real time.
1. Computer Vision Form Breakdown Detection
Primary signal: movement patterns - joint angles, bar path, torso lean, depth, and symmetry tracked rep by rep from video.
Why does this matter? Because technique drift is often the first visible clue that injury risk is climbing. As fatigue builds, those markers start to shift from one rep to the next.
In a squat, you might see less depth, knees caving in, or more forward torso lean. On the bench press, the bar can drop unevenly or touch higher on the chest. In a deadlift, the hips may shoot up before the chest, or the bar may drift away from the body. These changes often show up before full rep failure.
Research shows that fatigue leads to fairly predictable kinematic changes in the squat, bench press, and deadlift, especially near the hardest part of the rep.[6] In a University of Malta project, researchers trained a coaching model on 570 squat, bench press, and deadlift videos to estimate RPE and flag form deviations in real time.[5] So this method works well for visible technique drift, but it won't catch fatigue that isn't obvious on camera.
This approach helps most during working sets and the last reps of a set, when lifters are more likely to compensate. Tools like CueForm AI use this kind of video analysis on squat, bench press, and deadlift reps to flag technique breakdowns and give specific cues. That gives you a clearer call on whether to adjust, lower the load, or end the set before one messy rep turns into a problem.
The downside is simple: it only catches what the camera can see. Internal fatigue - like force loss or neural fatigue - can still hide behind reps that look clean. Camera angle, lighting, and clothing also affect reliability. A fixed side angle with a clear view of the joints and bar usually works best. If form still looks solid but output drops, bar speed will often show the fatigue first.
2. Bar Velocity Tracking and Rep-Speed Drop-Off
Primary signal: bar speed - more specifically, mean concentric velocity measured rep by rep in meters per second (m/s) during the lifting phase.
Bar velocity tracking tells you how much output you've lost, even when technique still looks clean. As the nervous system and muscle fibers get tired, they produce less force. The load stays the same, but the bar moves slower. That slowdown often shows up before visible compensation, which is why velocity loss matters early. If speed drops while form still looks steady, the next thing to check is muscle activity.
Velocity loss is the percentage drop from your fastest rep to your last rep in a set. A 10–20% VL cutoff fits strength and power work, 20–40% fits hypertrophy, and 40%+ points to severe fatigue.[13][14][15][16][20][22] Research links intra-set velocity loss with mechanical, metabolic, and perceptual fatigue markers.[11][7][13] In the gym, that gives you a simple call: end the set, lower the load, or stop before technique starts to break down.
This method works best during working sets at about 40–80% of 1RM, where the load-to-speed relationship is stable enough that rep-to-rep slowdowns usually reflect fatigue instead of random noise.[12][18][21] AI video tools can now measure bar speed with lab-level accuracy, including bias under 0.06 m/s and correlations of 0.94+.[8][9][10] If the velocity loss is obvious but the reason still isn't, EMG can help show whether the muscle itself is fatiguing.
The main catch is context. Bar speed can slow for reasons other than fatigue, like intentional tempo changes, low effort, shifts in technique, or normal day-to-day strength swings.[2][19][23] A fixed velocity threshold won't tell you why the bar slowed down. It only tells you that it did. That's why velocity data works best when you pair it with other signals, like what the set looked like on camera and how it felt in the moment.
3. Surface EMG Muscle Fatigue Analysis
Primary signal: electrical activity in specific muscles, measured through skin electrodes. AI tracks median frequency (MDF), mean frequency (MF), and RMS amplitude to spot fatigue-related shifts. That makes sEMG best for pinpointing local muscle fatigue, not whole-body readiness.
As a muscle gets tired, frequency tends to drop while amplitude tends to rise. That pattern is well known. In practice, sEMG can show which muscle group is giving out first, like the triceps during a bench press or one side during a squat. Put simply, it helps you catch the muscle that starts failing before the rep visibly falls apart.
sEMG is most useful during repeated working sets. That’s where it can help flag the limiting muscle and cue a load drop or set cutoff before performance slips even more. Bar speed tells you output is falling. sEMG tells you which muscle is behind that drop.
The big drawback is signal quality. Electrode placement, skin prep, sweat, and movement artifacts can all throw off the reading. sEMG also only picks up muscles close to the skin, so deeper stabilizers may not show up fully. That’s why experts consistently treat sEMG as a complement to other signals, not a standalone verdict. If the sEMG data looks murky on its own, pair it with video, bar speed, and recovery signals.
4. Heart Rate Variability and Cardiovascular Stress Monitoring
Primary signal: HRV, with RMSSD as the main marker for day-to-day recovery. SDNN and LF/HF can add extra context.
Unlike sEMG, HRV gives you a whole-body view. It doesn’t tell you how one muscle is doing. It tells you more about systemic fatigue - the kind that builds over several days or even weeks from hard training, poor sleep, illness, or plain old life stress. If your morning RMSSD keeps drifting down for 10 to 14 days, that can point to overload before your gym performance starts to slip.
For clean data, measure HRV first thing in the morning, before caffeine or training, and stay in the same body position each day. The AI uses 1 to 2 weeks of readings to build your personal baseline, then follows a 7-day average to spot shifts that matter. If RMSSD stays below that 7-day average for several days, that trend can be a sign to:
- cut training volume
- lower intensity
- push back the next hard session
There’s a catch, though. HRV is a global signal, not a specific one. It can’t tell you if yesterday’s deadlifts beat up your quads more than your upper back. And it reacts to more than training load. Bad sleep, illness, dehydration, and work stress can all drag the number down. So if you get a low reading, don’t assume your lifting plan is the only reason.
That’s where pairing HRV with bar speed and movement analysis helps. HRV can flag whole-body stress, while velocity and movement data can show whether the issue is more tied to a specific lift or pattern.
That’s why HRV works best when it’s fused with movement and velocity data.
5. Multisensor Data Fusion for Whole-Body Fatigue Detection
Primary signals: bar speed, IMU data, heart rate/HRV, sEMG, and training load metrics are fused into one fatigue score. That matters because a single signal can look fine even when fatigue is building under the surface.
Fatigue usually doesn’t show up in only one place. Bar speed might stay steady while heart rate patterns drift. sEMG might hint at strain before movement quality drops. That’s why one signal alone can miss the bigger picture. When these inputs are combined and weighted, the system can estimate whole-body fatigue more accurately than any one input on its own. In plain terms, it helps spot trouble before technique starts to fall apart.
Fusion also helps when the data seems to disagree. Instead of leaving coaches or athletes stuck with mixed signals, the model syncs the inputs, pulls out the key changes, and turns them into one usable call: a fatigue score on a 0–100 scale, along with an action recommendation.
In one controlled study using 9-axis IMUs, PPG-based HR/HRV, and sEMG in 25 basketball players, the model reached 94.2% fatigue classification accuracy.[24]
The catch is cost and setup. Full multisensor systems can get expensive fast, and more devices can also mean more noise in the data. Because of that, these models tend to work best when they’re built around personal baselines instead of generic thresholds. It also helps to treat the score as guidance, not the final word, and compare it with recent training load and performance. That sets up the next step: using the signal to adjust the session in real time.
How to Use These Fatigue Signals in Real Training
Fatigue data only helps if it changes what you do in the gym. That's where the fast payoff shows up: use the right signal in the right setting, then make the call.
For strength work, cap velocity loss at around 20%. For hypertrophy, let it drift a bit more, usually 30% to 40%.[25][26][27] If bar speed drops but your technique doesn't obviously fall apart, check video next.
Different lifters should lean on different signals.
For home gym lifters, video is usually the best fatigue tool. CueForm AI turns uploaded squat, bench, and deadlift videos into personalized technique cues. A simple setup works well: film your top sets across several sessions, then compare the feedback over time. That gives you a cheap, practical way to see whether fatigue is slowly chipping away at your form from week to week.
For personal trainers, AI fatigue feedback can help with in-session changes and make those changes easier to explain. If a client's squat depth and trunk control start to slip after a few sets, move the last barbell sets to goblet squats or machine work instead. Then use the footage to show the client exactly what changed. That tends to land better than saying, "You looked tired."
Strength coaches working with groups get the most from looking at trends across sessions, not one rough day. If several fatigue signals get worse over a few workouts - slower bar speeds, less steady form, higher heart-rate stress - that's a much stronger reason to schedule a lighter day or a deload week than one bad session on its own. When the same signals keep drifting in the wrong direction, cut volume or intensity in the next microcycle.
Use the summary below to match the signal to the decision.
| Who | Signal | Action |
|---|---|---|
| Home gym lifter | Video form analysis | Film top sets; use cue feedback to catch breakdown trends |
| Personal trainer | In-session form changes | Swap or reduce final sets; show client visual evidence |
| Strength coach | Multi-session fatigue trends | Pull back volume or intensity across a microcycle |
What Each AI Method Catches Best: A Side-by-Side Look
No single method catches every type of fatigue. Each one sees a different part of the picture.
Computer vision picks up visible form drift. Bar velocity shows changes in neuromuscular output. Surface EMG focuses on local muscle fatigue. HRV looks at recovery and readiness, not what happens during a set. Multisensor fusion gives the broadest view, but it also brings more setup, more data, and more room for confusion.
The table below makes those trade-offs easy to scan.
| Method | Primary Signal | Best at Detecting | Best Use Case | Main Limitation |
|---|---|---|---|---|
| Computer Vision Form Breakdown | Joint angles, bar path, symmetry | Visible form degradation and technique drift | Lifters filming squats, bench press, and deadlifts for technique feedback | Can't directly measure internal or autonomic fatigue |
| Bar Velocity Tracking | Concentric rep speed | Neuromuscular fatigue and proximity to failure | Strength athletes auto-regulating load with velocity-based training | Requires specialized hardware; doesn't assess form quality |
| Surface EMG | Muscle electrical activity (amplitude/frequency) | Local muscle fatigue in specific muscles | Research labs, high-performance centers, and rehab monitoring | Costly setup; prone to movement artifacts; impractical for most lifters |
| HRV & Cardiovascular Monitoring | Beat-to-beat heart rhythm variation | Systemic fatigue and daily readiness | Morning readiness checks and long-term load management | Influenced by lifestyle factors; weak for local muscle fatigue |
| Multisensor Data Fusion | Combined video, velocity, HRV, and training data | Whole-body fatigue state and performance risk | Smart gyms, pro teams, and lifters using multiple tracking tools | Complex setup; depends on data quality; hard to interpret |
For most lifters training at home or in a commercial gym, computer vision is the simplest place to start. Why? It only needs a phone camera.
CueForm AI fits right into that setup. Upload a squat, bench press, or deadlift video, and you get personalized technique feedback with clear, actionable cues.
Conclusion
AI doesn’t replace coaching judgment. It helps you spot fatigue before it gets missed.
It turns fatigue into signals you can track: slower reps, form that starts to drift, and lower HRV. That data won’t decide anything on its own. What it does is give you better inputs so you can make the call with more confidence.
The most useful signal depends on the kind of fatigue you want to catch. Match the method to the problem in front of you: use video to spot form drift, bar speed to catch output loss, and HRV to check whole-body recovery.
Then make that signal mean something in the gym. Pick one signal and connect it to one action. For example, if squat velocity drops by more than 20% from the first rep, end the set [1][17]. That simple rule can help stop fatigue from turning into sloppy reps and a higher risk of injury.
CueForm AI reviews squat, bench press, and deadlift video and gives rep-by-rep cues on form breakdown and fatigue. The feedback matters only if you use it.
Use the data as a guardrail, not a rulebook.
FAQs
Which fatigue signal should I start with?
Start with bar velocity. It’s often one of the earliest signs of fatigue, and it tends to show up before you see a clear drop in strength.
Track the mean velocity of your warm-up sets against your 30-day rolling average. Then use velocity loss during working sets to help decide when a set should stop.
For extra context, CueForm AI can spot form breakdowns in video that also point to fatigue.
How do I know if fatigue is real and not just a bad set?
Look past mood or motivation. Real fatigue tends to show up in things you can actually see: a clear drop in bar speed from the first rep, plus repeatable form breakdowns that didn’t show up in earlier, fresher sets.
CueForm AI can help here. It tracks your squat, bench press, and deadlift technique over time, so it’s easier to tell the difference between one random off set and system-wide fatigue.
Can AI detect fatigue before my form breaks down?
Yes. AI can spot fatigue before your form fully falls apart by tracking small movement changes like bar speed, range of motion, joint angles, and rep tempo.
Those early shifts often show up before obvious technique problems do. That means tools like CueForm AI can catch issues such as bar path drift, slight spinal rounding, or knee valgus and give real-time cues.