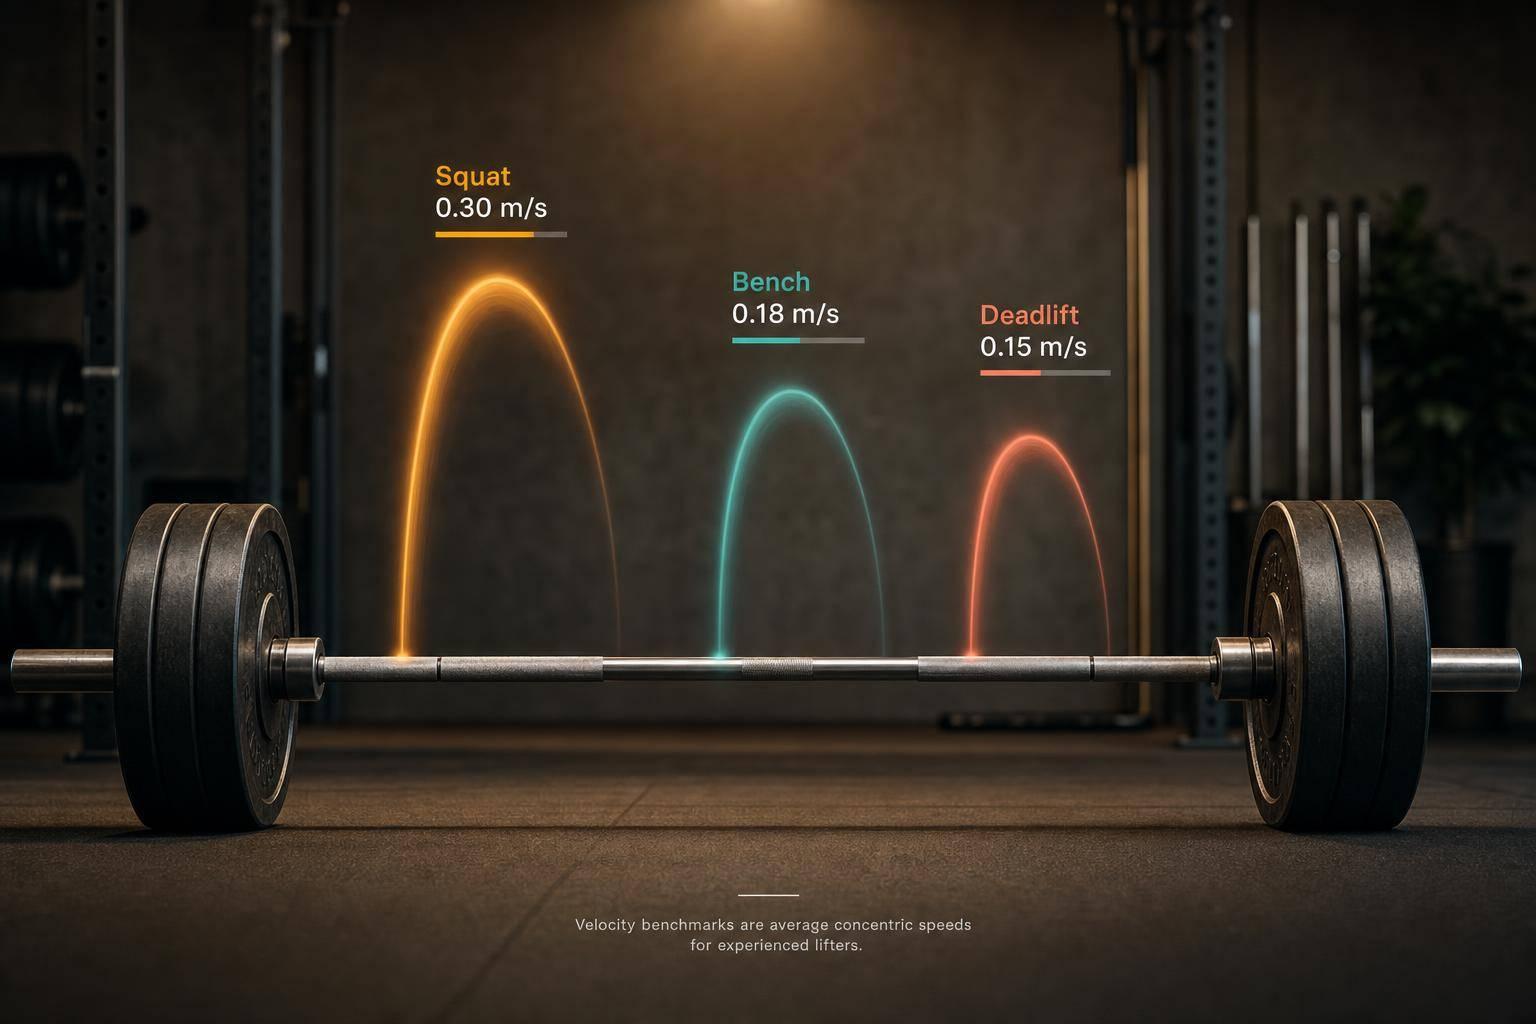
Velocity Benchmarks for Squat, Bench, Deadlift
If your bar speed is faster than usual at the same weight, you’re often in a good spot. If it’s slower, fatigue, setup, or form may be the issue.
I’d boil this article down to one idea: use mean concentric velocity (MCV) to match effort level in the squat, bench press, and deadlift, then use those numbers to guide load changes. In this piece, the squat has the clearest velocity ranges, with a 1RM often around 0.30–0.32 m/s. Bench press tends to be slower, with a 1RM around 0.15–0.20 m/s. Deadlift is also slower than squat, with a 1RM often around 0.12–0.24 m/s.
Here’s the short version:
- Squat: fastest of the three in most cases
- Bench press: slowest in most cases
- Deadlift: slower than squat, often between squat and bench at heavy loads
- A change of 0.07–0.10 m/s at the same load often means performance has shifted
- Day-to-day swings of ±0.03–0.05 m/s are normal
- If set velocity is off by more than 0.06 m/s, load changes of about 4%–5% of 1RM may make sense
- Stop a set after 15%–20% velocity loss from the fastest rep if the goal is to limit fatigue
| Lift | Typical 1RM Velocity | Main Takeaway |
|---|---|---|
| Back squat | 0.30–0.32 m/s | Clearest zones by effort |
| Bench press | 0.15–0.20 m/s | Lower speeds across most loads |
| Deadlift | 0.12–0.24 m/s | Slower from the floor; style matters |
Put simply, I’d use these ranges as a starting point, not a fixed rulebook. Your own numbers can shift based on technique, lift style, equipment, and device setup. The main job of velocity tracking is simple: compare today’s speed to your normal speed, then decide whether to keep the load, add a little, or cut it back.
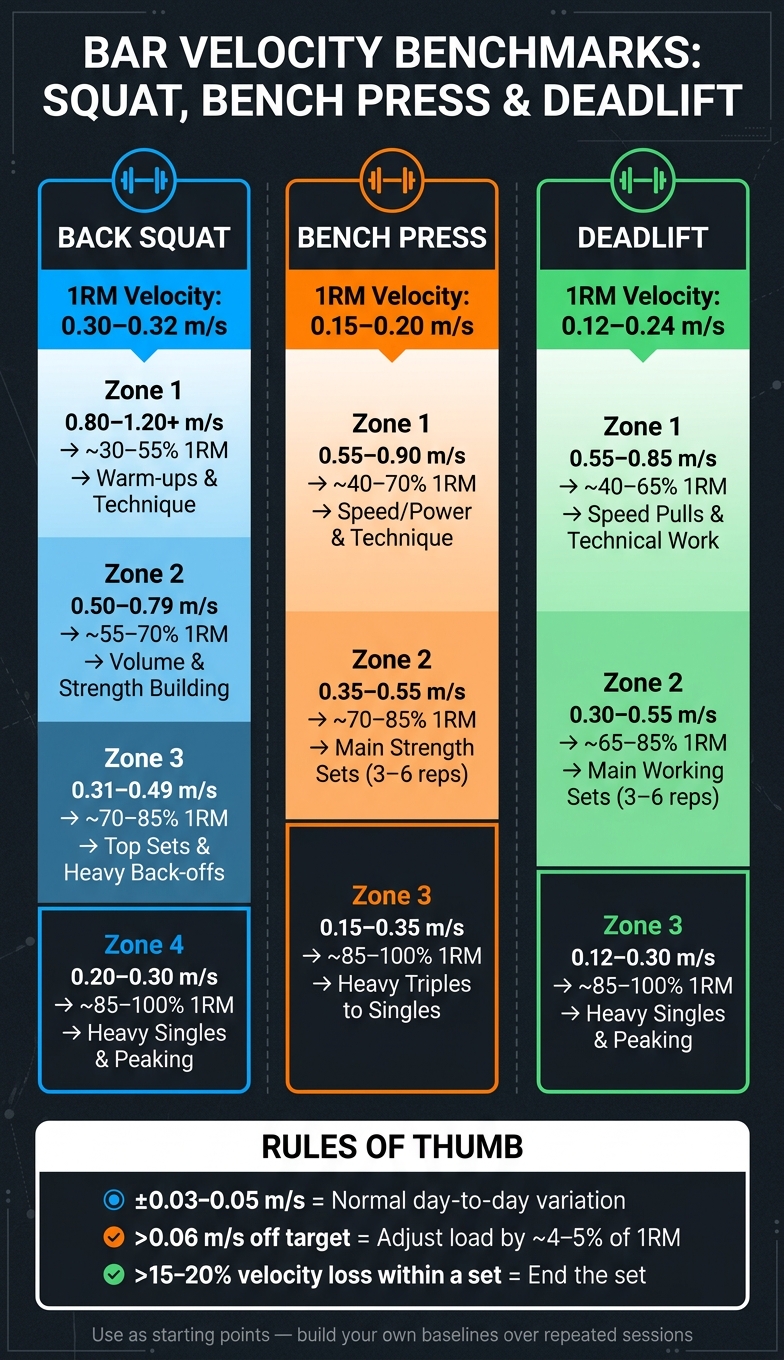
Velocity Benchmarks for Squat, Bench Press & Deadlift by %1RM
The Fundamentals Of Velocity Based Training (free VBT video course)
Back Squat Velocity Benchmarks by Effort Level
The back squat has a pretty steady, almost straight-line load-to-velocity pattern: as the load gets heavier, the bar moves slower in a fairly steady way. Squat speeds also tend to be higher than bench press speeds at the same relative load. That makes sense. The squat uses more total muscle mass and lets you produce more force overall, so squat benchmarks shouldn't be lifted straight from bench press charts[8][9].
In day-to-day training, a true squat 1RM usually shows up around 0.30–0.32 m/s MCV. So if the rep is moving faster than that, you're usually below your max. The table below gives a simple four-zone setup for back squat velocity. Treat these ranges as squat-specific starting points, since exact cutoffs can shift a bit from one lifter or device to another[7].
| Velocity Band (MCV) | Approx. %1RM | Training Intent |
|---|---|---|
| 0.80–1.20+ m/s | ~30–55% | Warm-ups, technique work, explosive submaximal sets |
| 0.50–0.79 m/s | ~55–70% | Volume work, strength-building sets |
| 0.31–0.49 m/s | ~70–85% | Top sets, heavy back-off sets, strength emphasis |
| 0.20–0.30 m/s | ~85–100% | Heavy singles, doubles, peaking attempts |
Light to Moderate Squat Velocity Zones
Reps in the 0.80–1.20+ m/s range should feel fast and under control. You're well below your max here, which makes this zone a good fit for warm-ups, technique practice, and explosive submaximal work. This isn't the place to grind. The idea is to move cleanly and stack quality reps without much fatigue.
The 0.50–0.79 m/s range is where a lot of productive volume work lives. At about 55–70% of 1RM, the weight feels like work, but it shouldn't feel all-out. This is a strong zone for building strength with steady depth, solid bracing, and a repeatable bar path.
Heavy to Near-Maximal Squat Velocity Zones
Once bar speed drops into the 0.31–0.49 m/s range, you're in heavy strength work - about 70–85% of 1RM. Reps slow down in a way you can feel right away. At this point, little things matter more: bracing, hitting the same depth each rep, and keeping the bar path steady. Top sets and heavy back-off sets often land here during a strength block.
The 0.20–0.30 m/s zone is near-max effort. The bar moves slowly, every rep needs full attention, and even a small session-to-session dip in velocity can point to fatigue or lower readiness. This zone works well for dialing in heavy singles and for watching fatigue or readiness across sessions.
Bench press and deadlift benchmarks use the same basic method, but their speed ranges are lower and not as clearly separated.
Bench Press and Deadlift Velocity Benchmarks
Bench and deadlift tend to move slower than squat, but the same velocity-based setup still works here.[13][14][4][3][16]
Bench Press: Speed Work, Strength Sets, and Heavy Singles
Bench press velocities are generally lower than squat velocities. A big reason is simple: the bench uses less total muscle mass and a shorter range of motion.[13][3] A bench press 1RM velocity usually lands around 0.15–0.20 m/s.[5][13][14][4]
| Velocity Band (MCV) | Approx. %1RM | Training Intent |
|---|---|---|
| 0.55–0.90 m/s | ~40–70% | Speed/power bench, rate of force development, technique work |
| 0.35–0.55 m/s | ~70–85% | Strength-speed sets, main working sets (3–6 reps) |
| 0.15–0.35 m/s | ~85–100% | Heavy triples to singles, peaking work |
Put plainly, if the bar is moving at 0.55–0.90 m/s, you're usually in lighter bench territory where speed, crisp reps, and bar path matter most. Drop into 0.35–0.55 m/s, and you're often in the range for your main strength work. Once you're down at 0.15–0.35 m/s, you're usually dealing with heavy sets where every rep looks and feels like work.
Deadlift: Speed Pulls, Working Sets, and Peaking Attempts
The deadlift starts from a dead stop, so bar speed is often lower than squat at the same relative load.[10][15][3][16] Deadlift 1RM velocity usually falls around 0.12–0.24 m/s. Conventional pulls often sit near the lower end of that range.[12][14][4][15]
| Velocity Band (MCV) | Approx. %1RM | Training Intent |
|---|---|---|
| 0.55–0.85 m/s | ~40–65% | Speed pulls, starting strength, technical reinforcement |
| 0.30–0.55 m/s | ~65–85% | Main working sets, 3–6 rep strength work |
| 0.12–0.30 m/s | ~85–100% | Heavy singles, last warm-ups, peaking attempts |
This is where context matters. A sumo deadlift and a conventional deadlift don't always look the same on a velocity chart, and limb length can change things too. So treat these cutoffs as practical benchmarks, not fixed rules.[10][15]
How to Use Velocity Benchmarks to Track Progress and Adjust Load
Once you have benchmark ranges for the squat, bench, and deadlift, the next step is simple: use those numbers to make decisions in the gym.
Checking Progress at a Fixed Load
One of the easiest ways to track progress is to compare today’s bar speed at a familiar load with your past baseline. Let’s say your back squat at 315 lb used to average 0.30 m/s, and now it’s hitting 0.36–0.38 m/s with solid technique. That’s a clear sign the load is moving more efficiently.
A change of 0.07–0.10 m/s usually means something. By contrast, ±0.03–0.05 m/s is normal day-to-day noise.[6]
Before you change the plan, look at the bigger picture. Sleep, stress, and recent training stress all matter. A slower bar doesn’t automatically mean you got weaker. Sometimes a rough week or a hard training block is enough to pull velocity down for a bit.
Most coaches suggest re-testing your load-velocity profile about every 4–6 weeks or after a training block. The goal is to check whether the same loads are moving faster over time.[6] That trend helps you decide whether to keep the load where it is, push it up, or pull it back.
Simple Load Adjustments Based on Target Velocity Zones
A good rule of thumb: if your average set velocity is more than 0.06 m/s away from the planned value, adjust the load by about 4–5% of your 1RM.[1]
Here’s what that looks like in practice:
| Bar Speed vs. Target Zone | Likely Cause | What to Do |
|---|---|---|
| Faster than target zone | High readiness or adaptation | Add 5–10 lb (bench) or 10–20 lb (squat/deadlift) |
| Within target zone | Performance is on track | Keep the load, complete planned sets |
| Slower than target zone | Fatigue or poor recovery | Drop load 5–10% to stay in the intended zone |
| Large velocity loss within a set | Excessive fatigue accumulating | End the set early or cut total volume |
For velocity loss within a set, stop when bar speed drops 15–20% from the fastest rep.[18][19] For example, if your first squat rep at 80% 1RM clocks 0.40 m/s, you’d stop the set once reps fall below about 0.32 m/s.
If the bar feels slow and fatigue doesn’t seem to explain it, look at technique before changing the prescription.
Connecting Bar Speed With Form Quality
Slow reps aren’t always about strength or fatigue. Sometimes the issue is form.
A squat bar drifting forward, loss of upper-back tightness, or weak leg drive on the bench can all hurt mechanical efficiency and slow the bar down, even if your strength hasn’t changed.[17][19]
When speed and effort don’t match, video review is usually the next step. If bar speed drops and there’s no clear fatigue reason, check the video for technique breakdowns before you change the load. CueForm AI can help flag those breakdowns from squat, bench, and deadlift video.
Conclusion: Velocity Ranges You Can Apply Next Session
Now that you have benchmark ranges, the next move is straightforward: use them to judge today’s set, then decide whether to hold the load, add a bit, or pull it back. The big 3 need their own target zones. Squat will usually move fastest, bench tends to be the slowest, and deadlift usually lands in the middle when loads get heavy.
At 90%–100% 1RM, bar speed drops hard across all three lifts.[8][2][11] Seeing that slowdown as it happens gives you a better read on how close you are to your limit that day. That’s especially helpful during peaking blocks and heavy single work, where small changes in speed can tell you a lot.
For your next session, use velocity as an auto-regulation check. Pick a lift-specific target zone, then compare the same load across sessions. If a set lands above the zone and your technique still looks steady, add load next time. If it drops below the zone, trim the load a little or look at fatigue and form first. Across several sessions, faster speed at the same load usually means you’re getting stronger.
Keep load, technique, rest, and setup the same so your comparisons mean something. Log load, velocity, and RPE for a few key sets each week. If the speed data doesn’t line up with how beat-up you feel, check your video. CueForm AI can flag squat, bench, and deadlift technique changes. That makes velocity tracking useful in practice, not just something nice to look at.
Use these ranges as starting points, then build your own benchmarks from repeated sessions.
FAQs
How do I find my normal bar speed baseline?
Record your lifts on a consistent basis for 2 to 3 weeks and track mean velocity during your normal training sessions. The goal is to build a baseline across 4 to 6 loads, usually between 45% and 95% of your estimated one-rep max.
A 30-day rolling average helps smooth out day-to-day swings, so you’re not overreacting to one off session. Once that baseline is in place, you can use CueForm AI to monitor your metrics and adjust intensity with real-time feedback.
Which matters more: bar speed, RPE, or technique?
All three matter most when you use them together. Bar speed gives you an objective, real-time look at performance and fatigue. RPE shows how hard the set feels. And technique helps keep movement safe and efficient.
When technique stays steady, bar speed and RPE make it easier to see when to push and when to back off. CueForm AI can bring these signals together by using video analysis to check form while tracking velocity.
Can I use the same velocity targets with different lifting styles?
No. The same velocity targets usually don’t work across different lifting styles because your own profile is usually more accurate.
Bar speed changes based on your limb length, your range of motion, and the lift you’re doing. A squat and a bench press simply don’t move the same way.
For example, a 1RM squat may move at around 0.3 m/s, while a 1RM bench press may be closer to 0.15 m/s. That gap is a good reminder that one target doesn’t fit every lift.
If you want the best load-velocity profile, use your own data instead of relying on the same target across the board.